72 Degrees or Bust: Inside the Homes Where Every Room Has a Sensor and a Spreadsheet
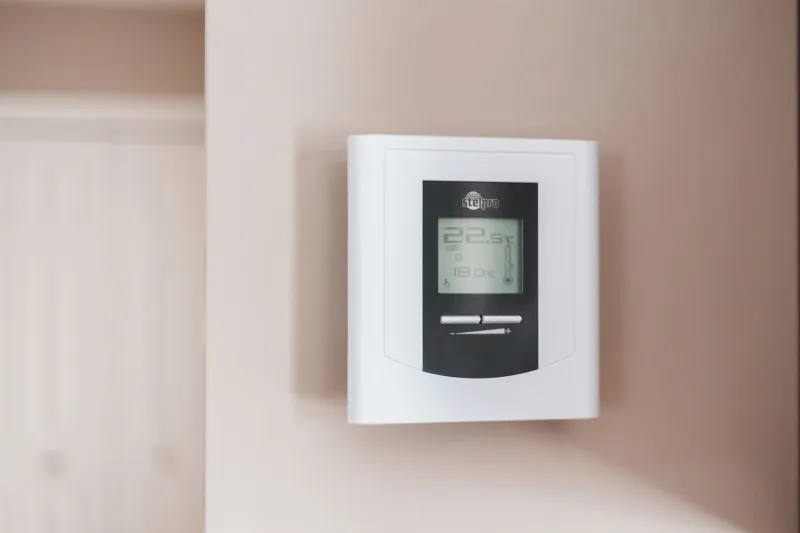
Somewhere in suburban Ohio, a man named Derek is eating breakfast and watching a dashboard on his laptop. Not the news. Not ESPN. A real-time grid of temperature and humidity readings from 23 different points inside his house — the basement corner near the water heater, the gap between the master bedroom door and the window, the spot above the refrigerator that inexplicably runs three degrees warmer than everything else in the kitchen.
He has been doing this for four years.
"My wife thought I was losing it at first," he admits. "Now she just asks me what the humidity is in the bathroom before she showers."
Welcome to the rabbit hole of home climate monitoring — a niche so specific, so data-dense, and so deeply satisfying to its practitioners that it barely registers on most people's radar. But spend any time in the forums, the Discord servers, or the dedicated subreddits, and you'll find a whole community of people who've essentially turned their houses into personal weather stations. They're tracking not just temperature, but humidity, dew point, air quality, barometric pressure, and in some cases, CO2 levels room by room. And they are obsessed.
It Started With One Sensor
The origin story is almost always the same. Someone gets frustrated — a bedroom that's always too cold, an energy bill that seems too high, a partner who insists the house is freezing while you're sweating through a T-shirt. They buy a single smart sensor, usually something cheap off Amazon. They download the app. They start checking it.
Then they buy another one.
"It's completely incremental," says Priya, a software engineer in Austin who now has sensors in 17 rooms and closets. "The first one just answered the question I already had. But then it raised five more questions. Why is the hallway always warmer? Is the HVAC actually cycling the way it's supposed to? Is there a cold spot near the baby's crib? You can't un-ask those questions once you've started."
This is the core psychology at play here, and it maps neatly onto basically every other obsessive hobby we've covered in this space. The data doesn't just answer questions — it generates them. And for a certain type of person, that loop is more addictive than any video game.
The Dashboard Is the Destination
For the more committed practitioners, the raw data is only half the point. The other half is visualization. Home Assistant — a free, open-source home automation platform — has become the preferred playground for the serious crowd. It lets users build custom dashboards, set up alerts, log historical data, and create graphs that track temperature trends over days, weeks, or months.
Some of these dashboards are genuinely stunning. Think color gradients showing heat distribution across a floor plan, line graphs comparing indoor temperature to outdoor weather patterns, or automated notifications that fire off when a room's humidity creeps above 60 percent. One user in a popular home automation forum posted a visualization that overlaid his HVAC runtime data against hourly outdoor temperature readings for an entire year. The thread got over 400 comments.
"I spent more time building the dashboard than I did on my last work project," he wrote. "Zero regrets."
Does Any of This Actually Save Money?
Fair question. And the honest answer is: sometimes, sort of, but that's probably not why people do it.
There are genuine efficiency wins to be found. Identifying a poorly insulated wall, catching an HVAC system that's short-cycling, discovering that your attic is hemorrhaging heat every night in January — these are real findings that can translate to real savings. Several people in these communities report meaningful reductions in their energy bills after acting on what their data revealed.
But plenty of others will quietly admit that the savings don't really justify the hours spent. One guy in a Seattle-based home efficiency group estimated he'd spent close to $600 on sensors, hubs, and smart plugs — and maybe saved $180 over the past two years.
"I know the math doesn't work," he says, laughing. "But I also know exactly what my bedroom does between 2 and 5 a.m. in February. That feels valuable. I can't explain why."
And that's kind of the whole thing, isn't it? The appeal isn't purely economic. It's about knowing. About having visibility into a system — your home — that most people treat as a black box. The furnace kicks on. The AC hums. Things feel roughly comfortable or they don't. But these folks want to see the actual mechanics of it, charted and timestamped and searchable.
The Thermostat Wars Are Real
Of course, not everyone in the household is always on board. The temperature tracking community has a well-documented secondary conflict: the domestic thermostat war. You know the one. Two people, one thermostat, wildly different comfort thresholds.
Here's where the data can actually do some diplomatic heavy lifting. More than a few people in these communities have used their sensor logs as evidence in household temperature negotiations. "I showed my husband the actual readings," one user posted. "It was 68 in the living room and 74 in the bedroom. I wasn't crazy. The data proved it." Her post got a standing ovation in the comments.
Some couples have even set up automated compromises — the thermostat adjusts based on time of day, room occupancy, or a schedule they built together. Romantic? Debatable. Effective? Apparently yes.
The Community That Holds It Together
Like most niche obsessions, this one has a social layer that keeps people coming back. The forums are full of people sharing sensor placement tips, debating the merits of different humidity measurement standards, and celebrating when they finally crack a temperature mystery that's been bothering them for months.
There's a particular joy in the "I figured it out" post — the one where someone reveals that the cold corner in their dining room was caused by a gap in the rim joist, or that their second-floor office runs hot because the return air vent is blocked by a bookshelf. These aren't just home improvement wins. They're detective stories with a satisfying resolution.
And maybe that's the most honest way to describe what this hobby actually is: a slow-burn mystery where your house is the suspect, the sensors are your evidence, and the spreadsheet is your case file.
Derek, for his part, has no plans to stop. He's currently eyeing a set of outdoor sensors to track microclimate variations in his backyard. His wife has accepted this.
"She asked me last week if we could put one in the garage," he says. "So I think she gets it now."
Once you start measuring, you never really stop.